A brief overview of financial performance metrics, followed by formulas for key indicators like revenue, gross margin, operating expenses, net income, profit margin, EBITDA, and EBIT.
1. Revenue (Sales)
- Formula: Revenue = Units Sold × Price Per Unit
- Definition: This is the total income generated from sales of goods or services before any costs or expenses are deducted.
2. Gross Margin
- Formula: Gross Margin = Revenue - Cost of Goods Sold (COGS)\Revenue times 100
- Definition: Gross margin measures the percentage of revenue that exceeds the cost of producing goods or services. It indicates the efficiency of production and pricing.
3. Operating Expenses
- Formula: Operating Expenses = Selling, General & Administrative Expenses (SG&A) + Research & Development (R&D) + Depreciation and Amortization + Other Operating Expenses
- Definition: These are the expenses incurred from normal business operations, excluding the cost of goods sold.
4. Net Income
- Formula: Net Income = Revenue - (COGS + Operating Expenses + Taxes + Interest)
- Definition: This is the final profit after all expenses, including interest, taxes, depreciation, and amortization, have been deducted from revenue. It reflects the company's profitability.
5. Profit Margin
- Formula: Profit Margin = Net Income / Revenue times 100
- Definition: Profit margin shows the percentage of revenue that remains as profit after all expenses are deducted.
6. EBITDA (Earnings Before Interest, Taxes, Depreciation, and Amortization)
- Formula: EBITDA = Net Income + Interest + Taxes + Depreciation + Amortization
- Definition: EBITDA measures a company's operating performance by focusing on earnings before the impact of financial and accounting decisions, such as interest and depreciation.
7. EBIT (Earnings Before Interest and Taxes)
- Formula: EBIT = Net Income + Interest + Taxes
- Definition: EBIT indicates a company’s profitability by measuring earnings from core business activities, excluding the effects of interest and taxes.
Example Table (Summarizing Financial Metrics)
Metric | Formula | Value |
|---|---|---|
Revenue | Units Sold × Price Per Unit | $500,000 |
Gross Margin | (Revenue - COGS) / Revenue × 100 | 45% |
Operating Expenses | SG&A + R&D + Other Operating Expenses | $100,000 |
Net Income | Revenue - Total Expenses | $75,000 |
Profit Margin | Net Income / Revenue × 100 | 15% |
EBITDA | Net Income + Interest + Taxes + Depreciation | $120,000 |
EBIT | Net Income + Interest + Taxes | $95,000 |
Sample Chart: Gross Margin vs. Net Income
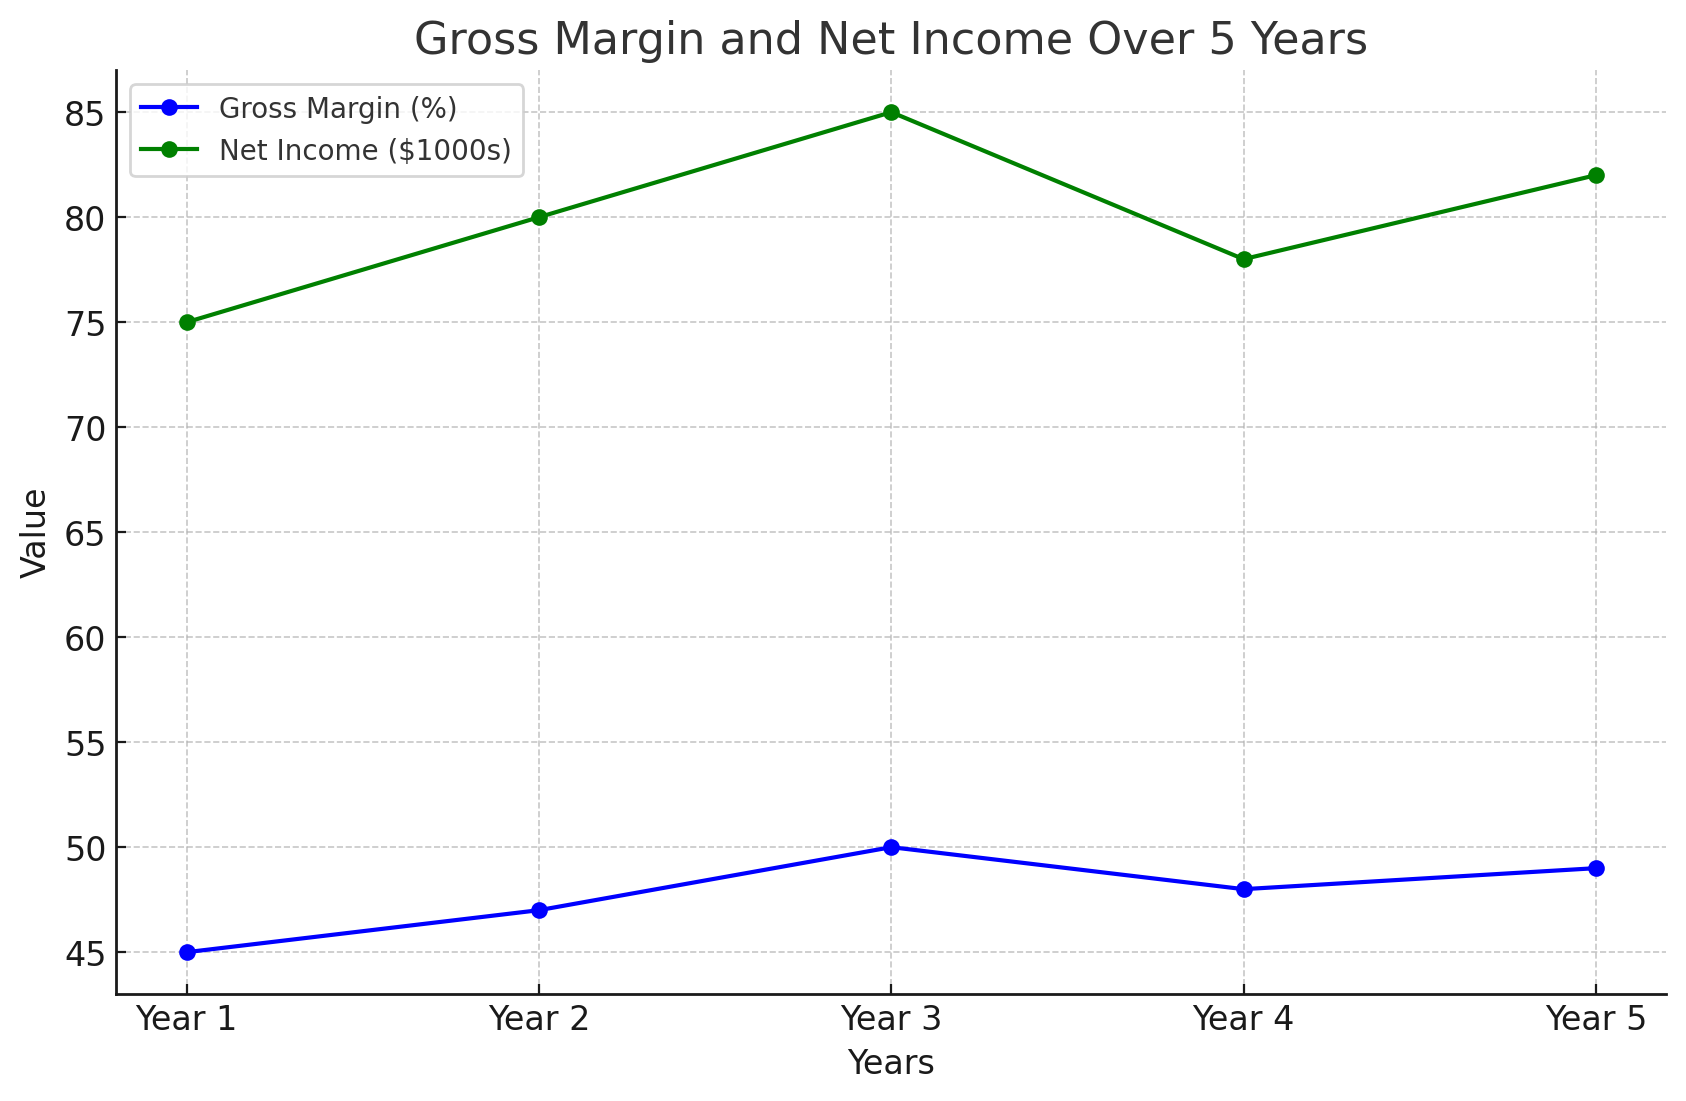
The chart above visually represents the relationship between Gross Margin and Net Income over a five-year period. It illustrates that while gross margin remains relatively stable between 45% and 50%, net income shows some fluctuation, indicating potential changes in operating expenses, interest, taxes, or other factors influencing profitability.
Understanding Financial Statements
Financial statements are key tools for assessing a company’s financial health. Even though they might seem overwhelming at first, learning to read and understand them is essential for both businesses and individuals. Let’s break down the three main financial statements and discuss their importance in making informed financial decisions.
1. Balance Sheet
- Definition: A balance sheet provides a snapshot of a company’s financial position at a specific point in time. It lists:
- Assets: What the company owns (e.g., cash, inventory, property).
- Liabilities: What the company owes (e.g., loans, accounts payable).
- Equity: The difference between assets and liabilities, representing the shareholders' stake in the company.
- Purpose: It gives insight into the company's financial strength and its ability to meet obligations.
2. Income Statement (Profit and Loss Statement)
- Definition: This statement shows the company’s revenues and expenses over a specific period (e.g., quarterly or annually). Key components include:
- Revenue: Total income from sales or services.
- Expenses: Costs incurred, including operating costs, interest, taxes, etc.
- Net Income: The company's profit or loss after all expenses have been deducted from revenue.
- Purpose: The income statement measures profitability, indicating how well the company generates earnings relative to its costs.
3. Cash Flow Statement
- Definition: The cash flow statement shows the inflow and outflow of cash over a given period. It breaks down cash flow into three categories:
- Operating Activities: Cash generated or used in day-to-day business operations.
- Investing Activities: Cash spent on investments like property, equipment, or acquisitions.
- Financing Activities: Cash related to borrowing, repaying debts, or issuing stock.
- Purpose: It provides insight into a company's liquidity and ability to generate cash to cover debts and fund operations.
Importance of Financial Statements
Financial statements are vital for several reasons:
- Financial Health: They allow businesses and individuals to evaluate financial stability.
- Investment Decisions: Investors use financial statements to assess the profitability and risks associated with a business.
- Tax Planning: Understanding income and expenses helps with accurate tax filings and planning.
- Cash Flow Management: A solid grasp of the cash flow statement helps avoid cash shortages, ensuring the business can cover its expenses and investments.
Cash Flow: Why It Matters
Cash flow is the lifeblood of any business. It shows how much cash is coming in and going out during a period and is crucial for planning and ensuring the business remains solvent.
Common Cash Flow Management Mistakes:
- Failure to Monitor: Small businesses often neglect to track cash flow consistently. This can lead to mismanagement of funds and cash shortages.
- Not Planning for Unexpected Expenses: Businesses should maintain a reserve for unforeseen costs, such as repairs or slow periods.
- Ignoring Cash Flow Cycles: Seasonal businesses or those with irregular cash flows need to anticipate these cycles to avoid liquidity problems.
How to Get Started
For beginners, the best approach is to start with a simple, clear financial statement template. By understanding the basic structure and components, you’ll be better equipped to make informed decisions related to investments, taxes, and long-term financial planning.